
Anatomy of a recession

I meant to send this to all subscribers but instead it only went out to paid subscribers. Apologies if you received this twice today.
The biggest market-moving headline over the past 24 hours came out of the Wall St Journal saying that Trump is considering pulling out of Iran and leaving the Strait of Hormuz closed. I place little weight on his words and instead am following the movement of his military assets as the primary signal. The arrival of troops in the Middle East tells me that this conflict will last beyond the end of April, with further repercussions on global commodity prices.
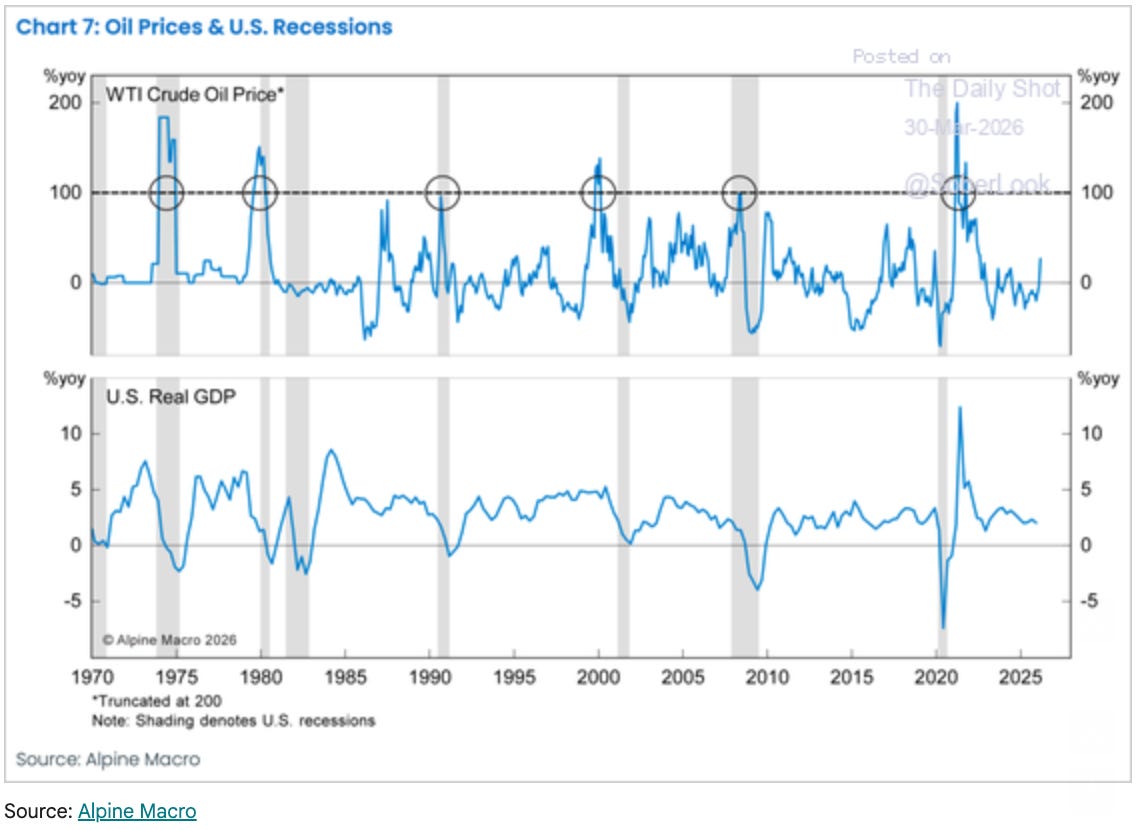
I want to shift our attention to what I think is the bigger story that is unfolding as a result of the war in Iran - a global recession that may unfold over the course of this year. Any seasoned student of economic history would know that an energy shock is often a precursor to a recession, as it creates demand destruction and consumes a larger share of spending that otherwise would be spent on goods and services. The inflationary effects also contribute to tighter monetary policy and worsening liquidity going into the recession. In the chart below (courtesy of Alpine Macro), a surge in oil prices has preceded five out of the last seven recessions. I didn’t count 2020 as the surge in oil happened after the recession, not before.
The recipe of a typical recession goes like this:
Financial excess and over-optimistic sentiment building up to the recession
Energy shock that causes demand destruction
Tightening liquidity and a paralyzed central bank that is slow to respond due to surging inflation
#1 creates the kindling and leverage while #2 and #3 prevent the central bank from acting as a natural stabilizer.
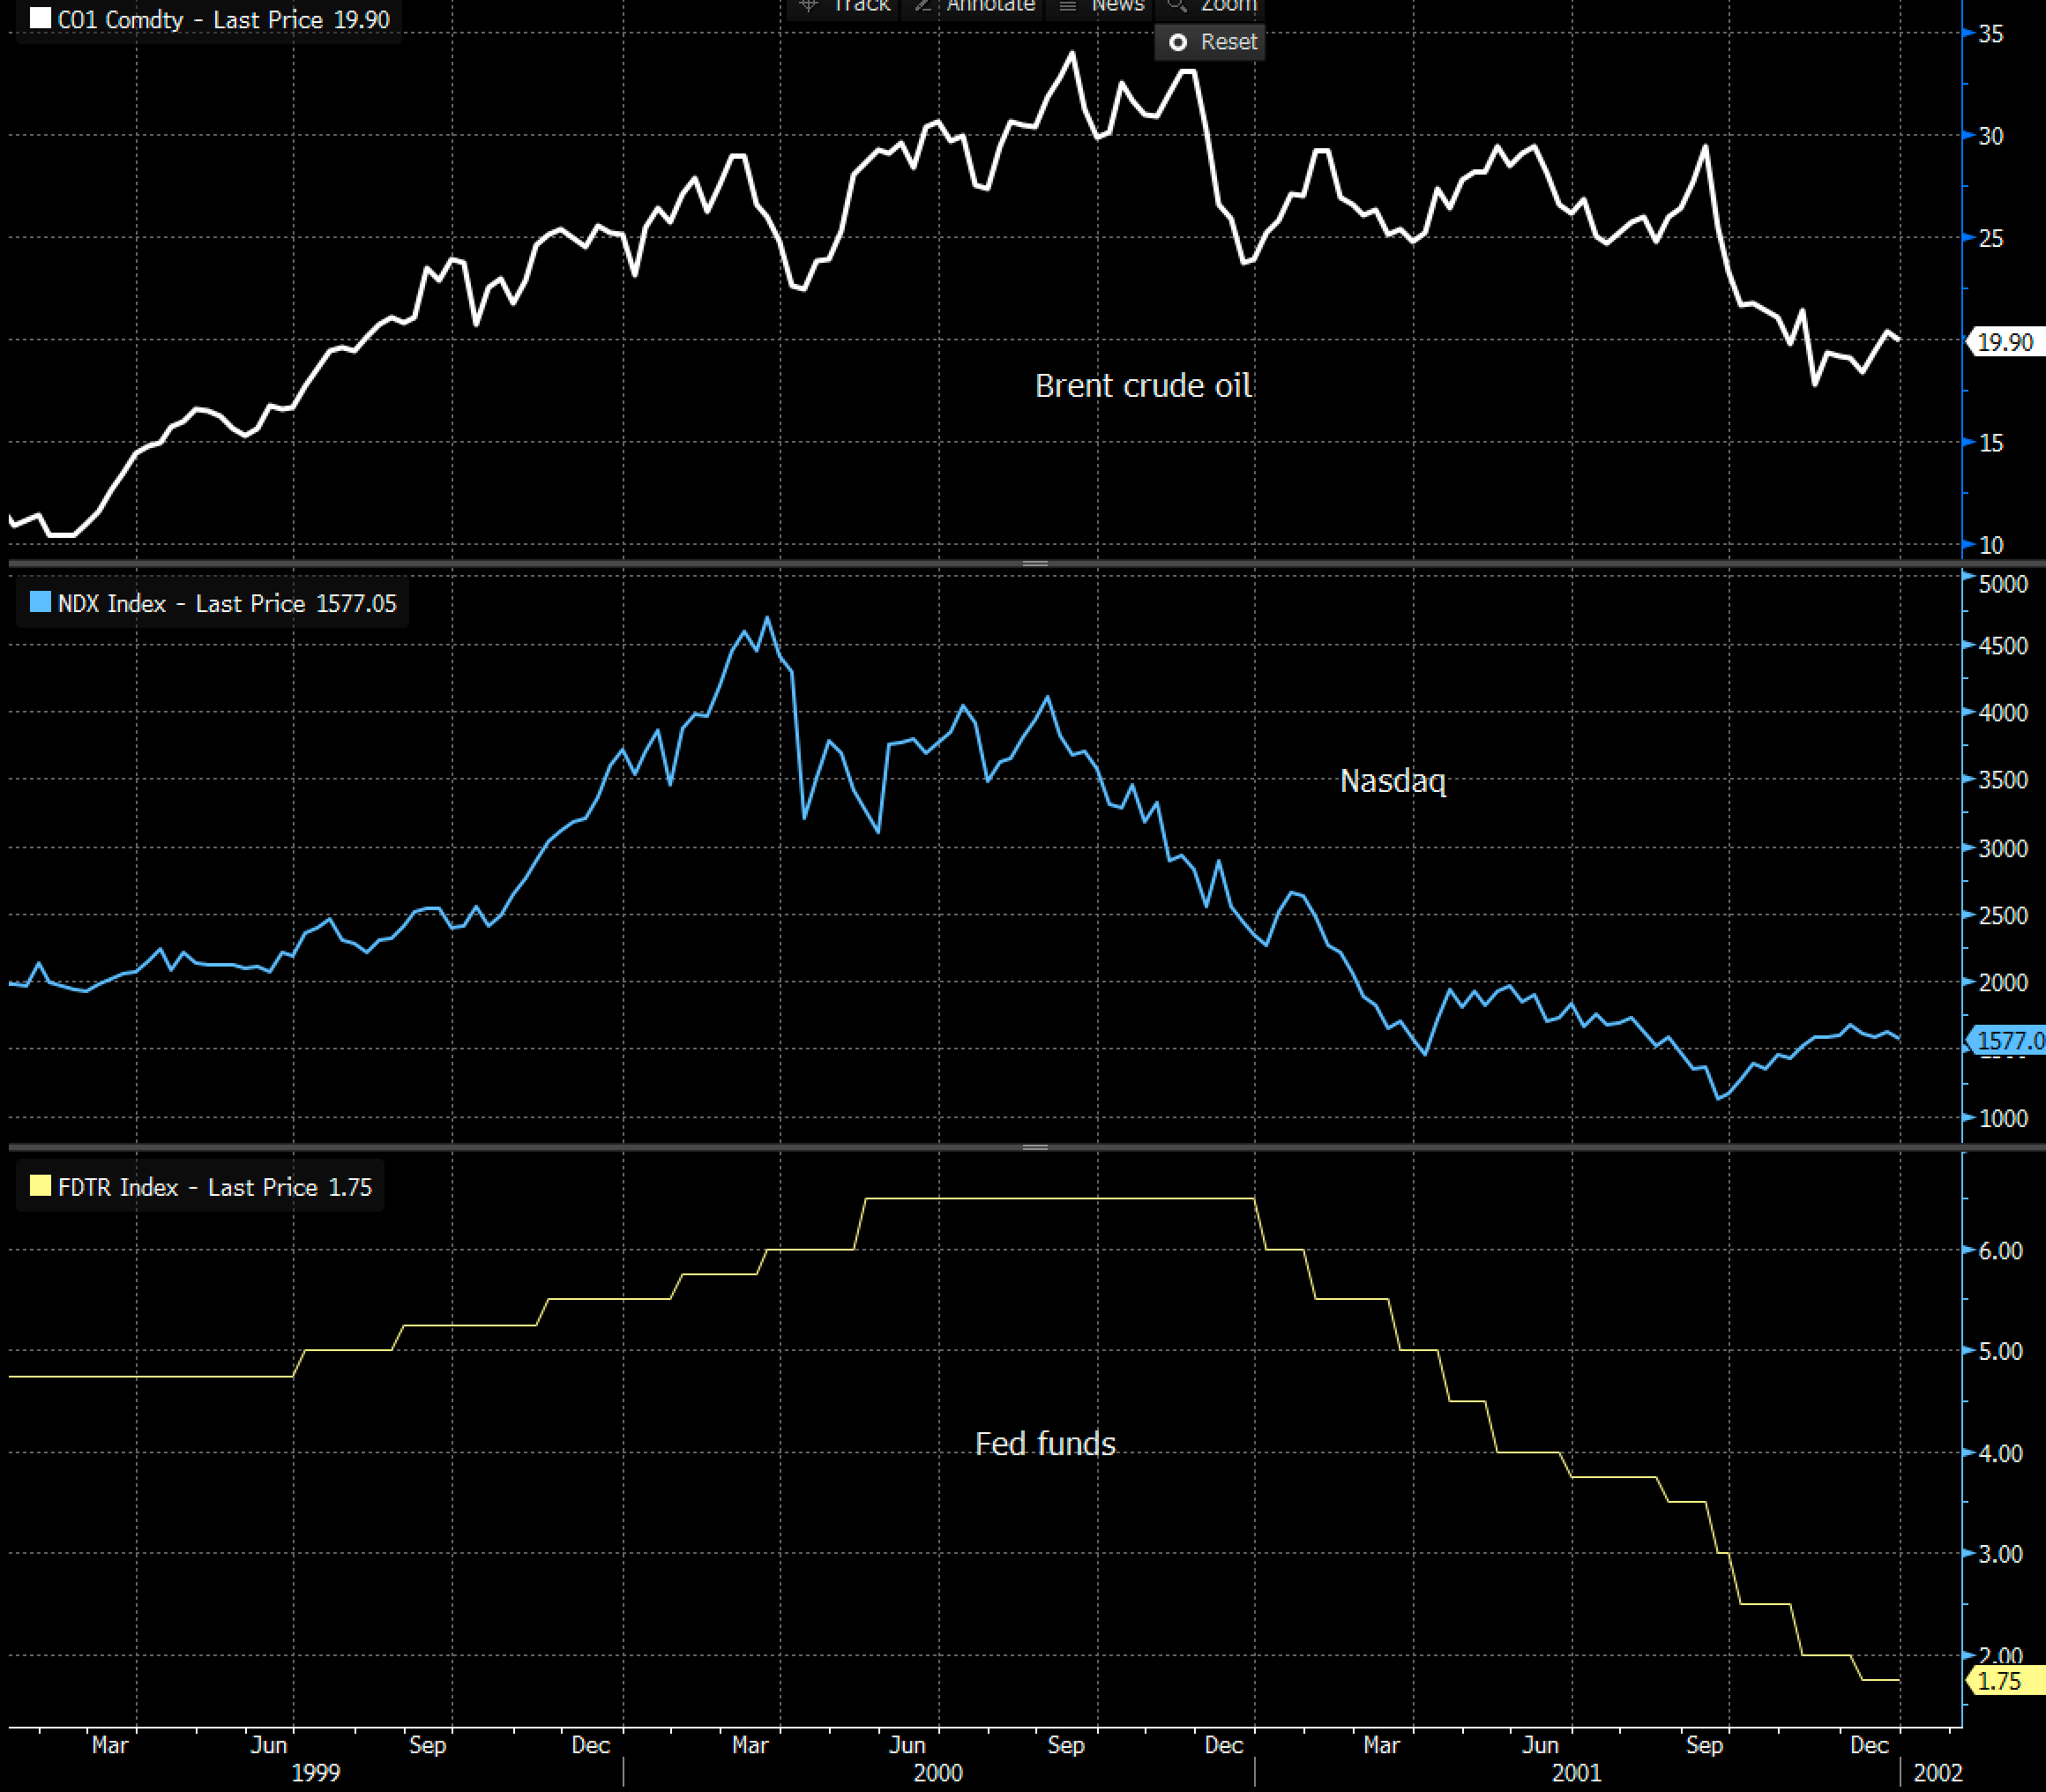
Case Study - Bursting of the 2000 tech bubble
The excesses of the dot-com boom provided the tinder and leverage for the following recession of 2000-2002. The peak of the Nasdaq occurred in March 2000, but the bull market in oil continued until Q3 of that year. The Fed was still hiking rates in June, and kept rates on hold until the end of the year despite the Nasdaq selling off 50% from its peak.
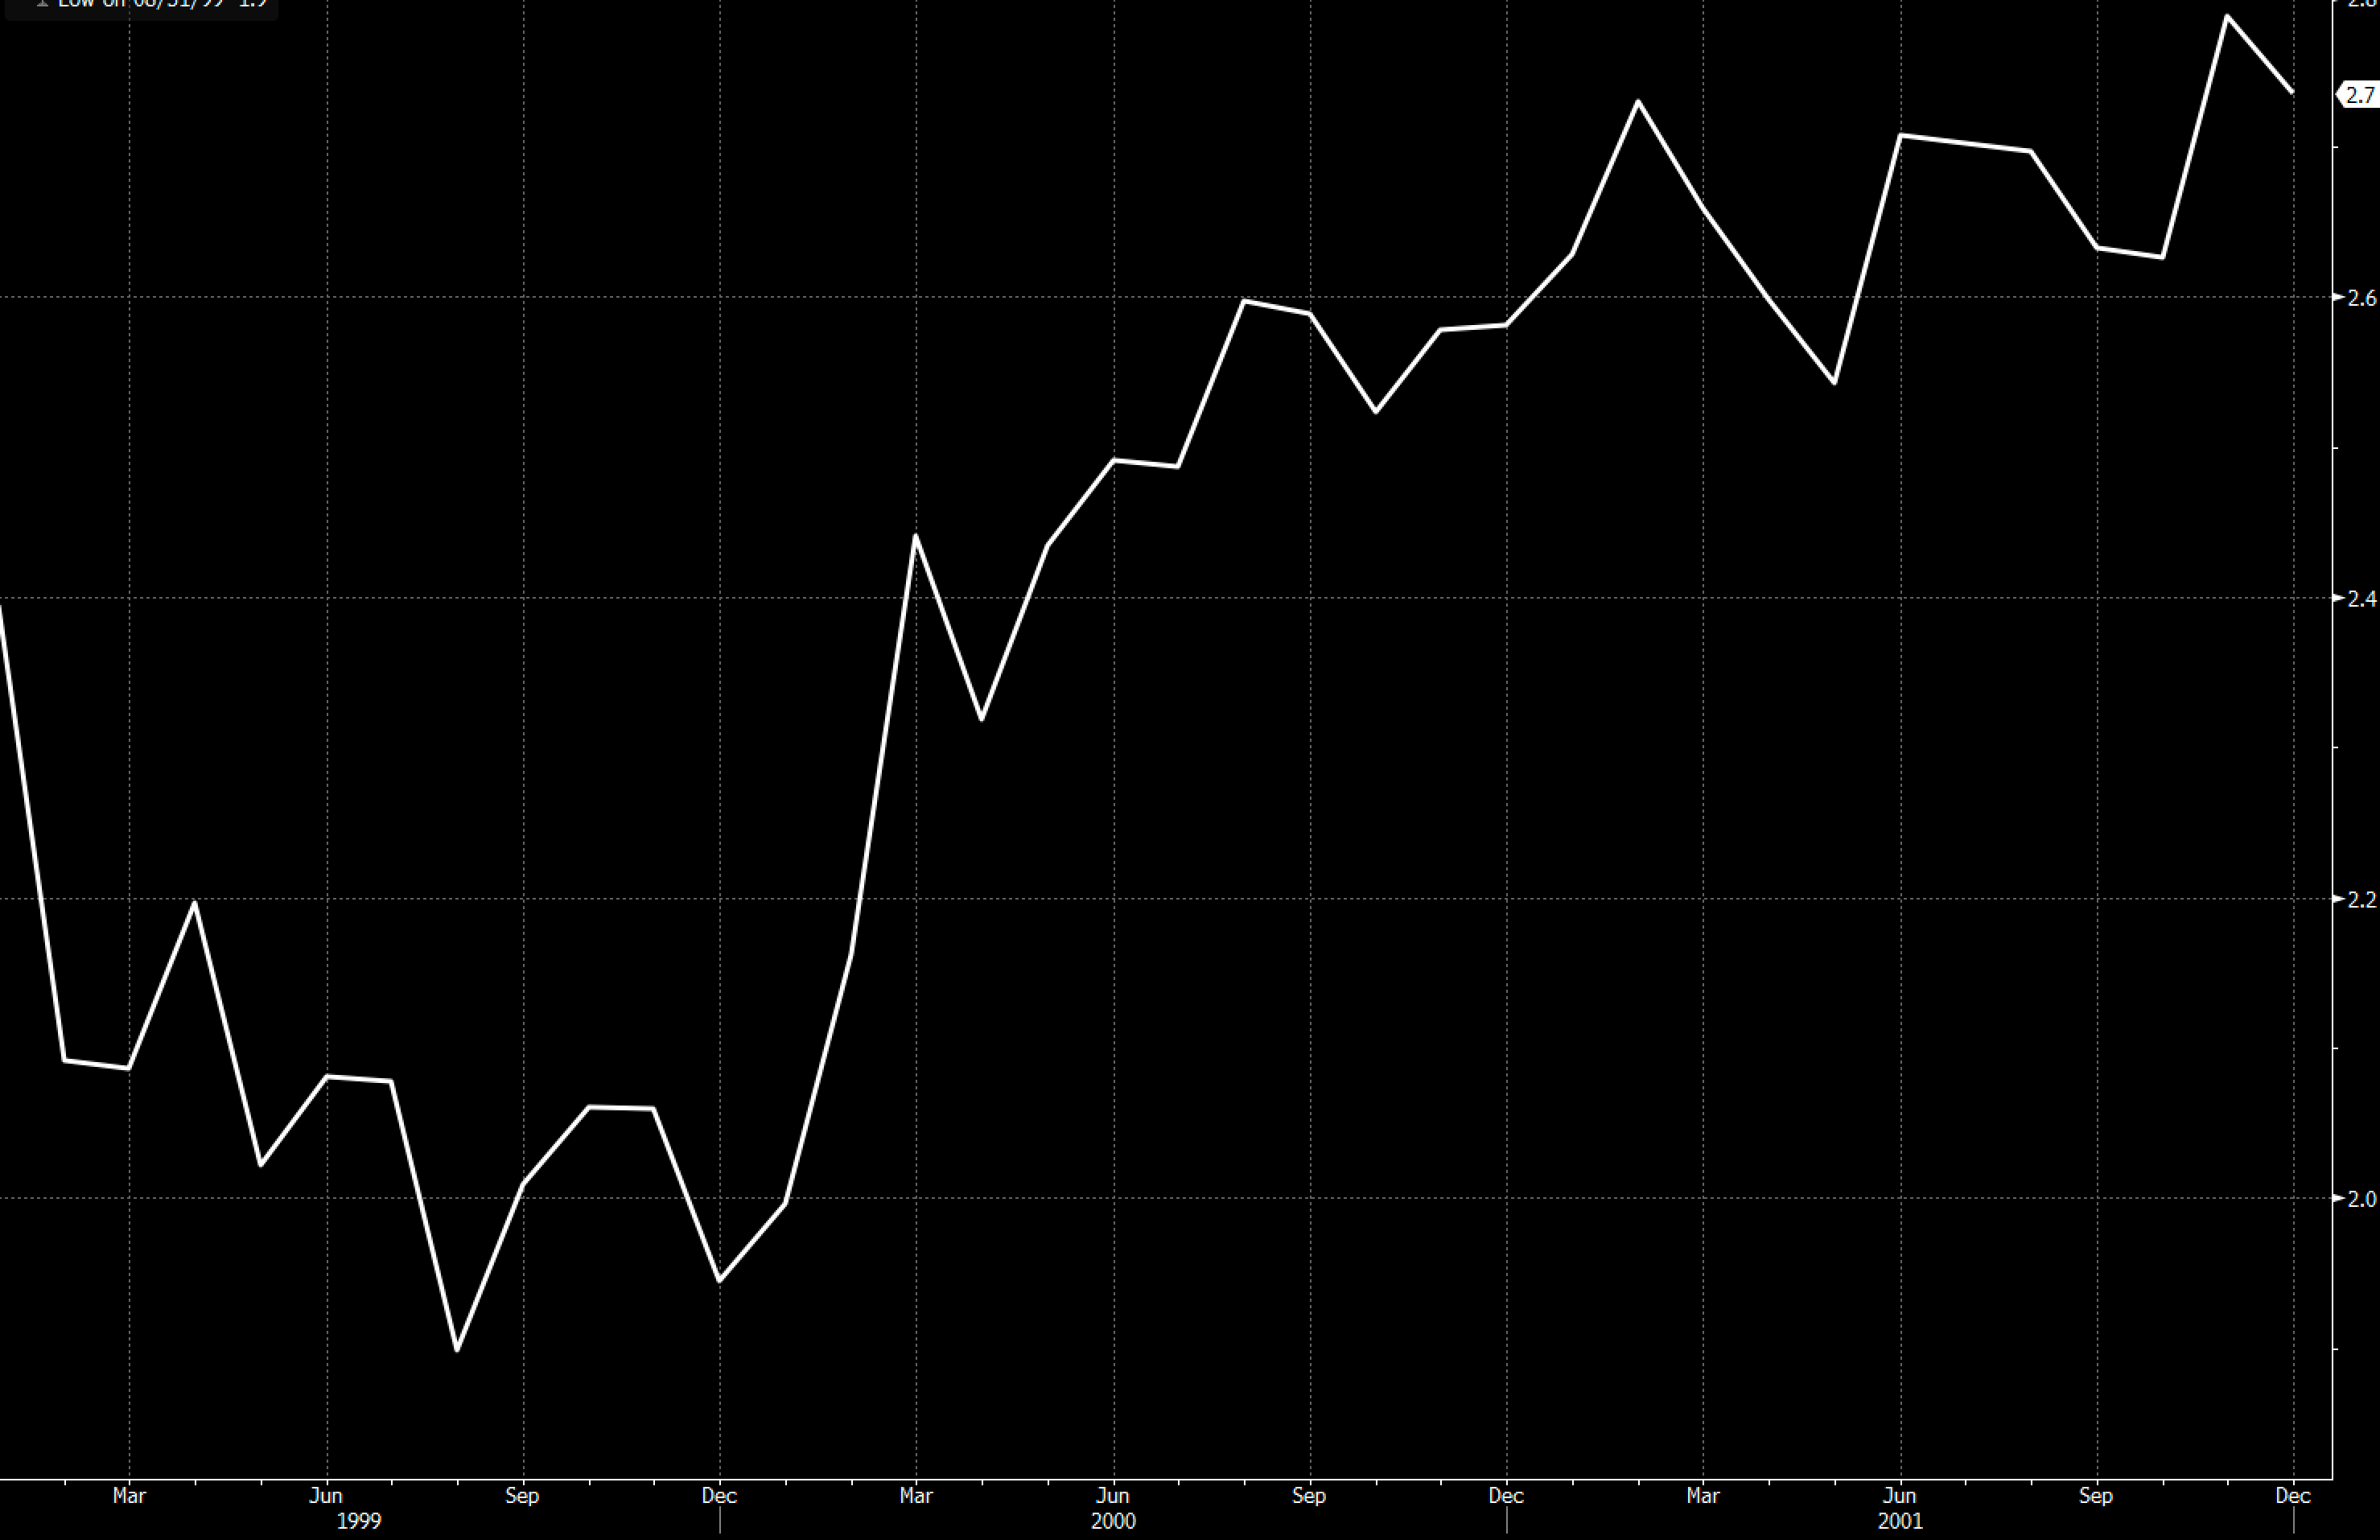
Why did the Fed stay on hold for so long? Core CPI was still above 2.5% all the way into the end of 2000, preventing the Fed from carrying out its duel mandate.
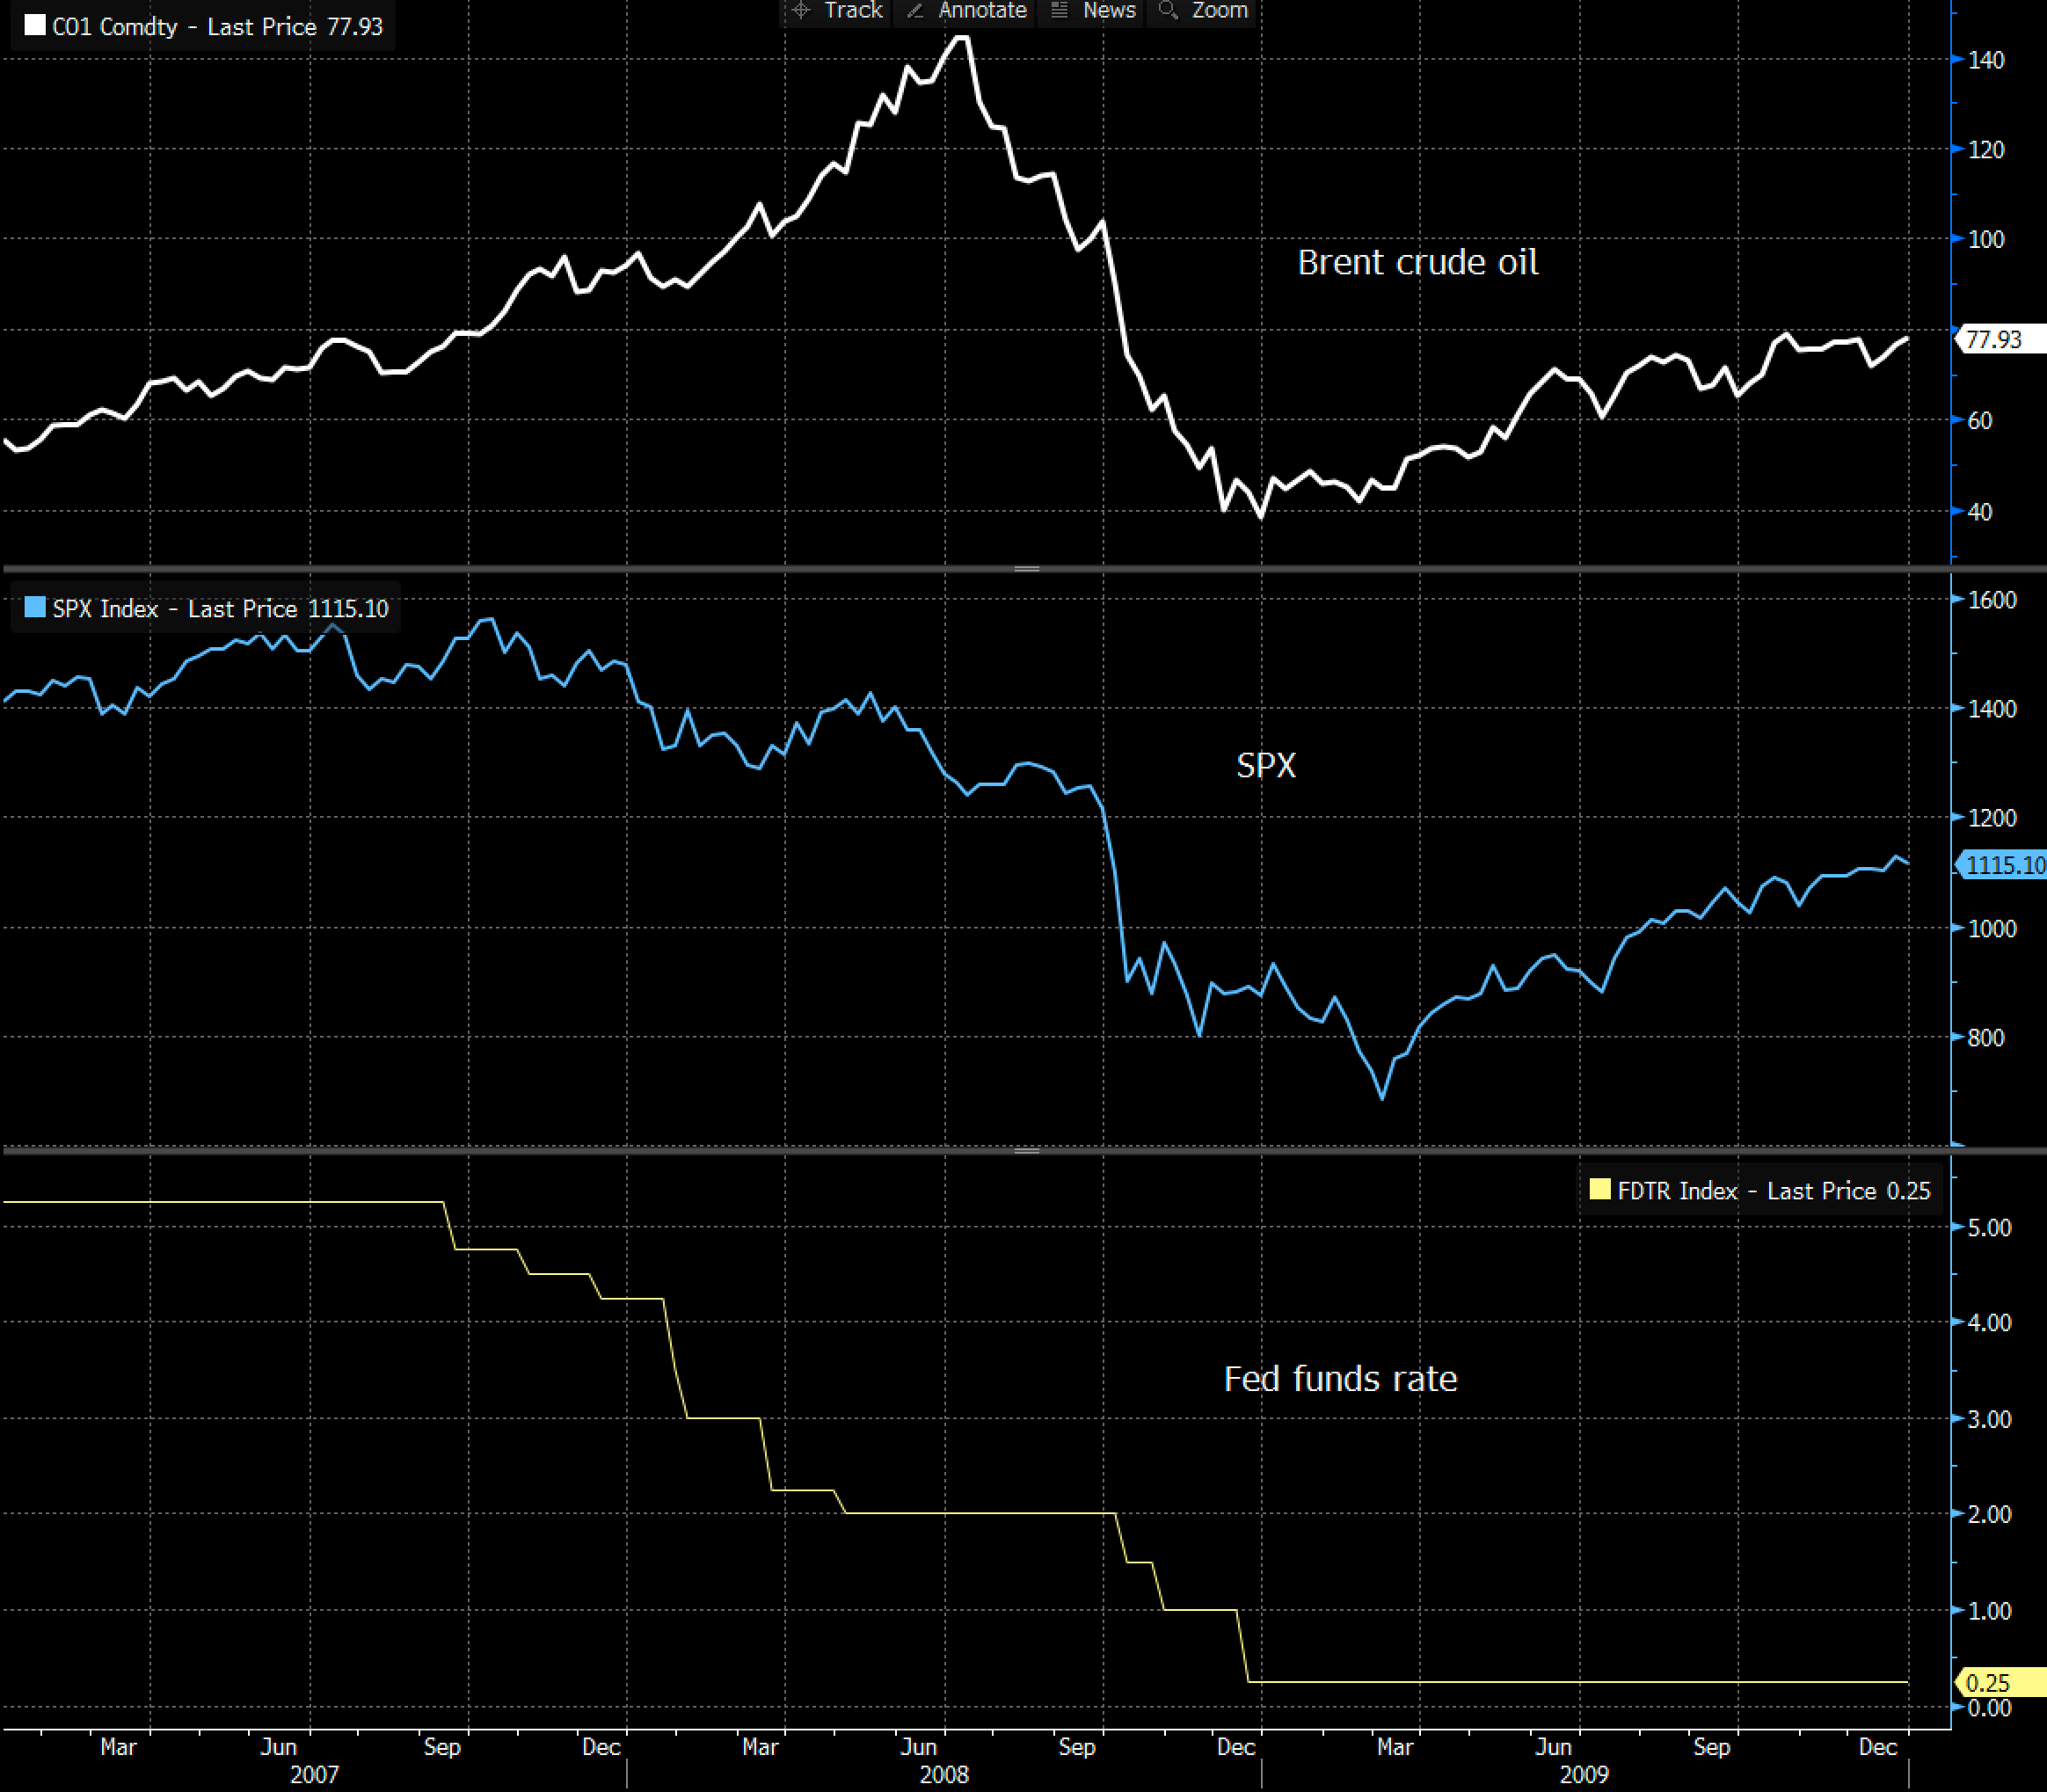
Case study #2 - the Great Financial Crisis
In 2007, cracks were already showing in the economy. Housing prices had been declined since 2006, and economic data was slowing down. The Fed started cutting in late 2007, and accelerated their cuts when Bear Stearns went under in March 2008. However, oil prices continued to surge to new highs in 2008, and core CPI remained above 2%. If it weren’t for oil and inflation, the Fed probably could have cut more aggressively (not that it would have prevented the financial crisis from happening).
The recipe for a recession today
In present day, we have financial excesses in the form of uncontrolled investment and spending on AI without a clear future payoff and a slow motion train wreck in private credit. The evolving capabilities of AI are also disrupting the labor market and existing businesses that private credit lent too.
We now have a commodities price shock that extends beyond oil into fertilizer, food prices, and basic inputs of industry.
Finally, we have a Fed that is now paralyzed with indecision, with many mentions of the word “uncertainty” in its most recent press conference.
The conditions are now ripe for a recession to unfold by the end of this year. I’ve already mentioned previously in this blog that I’ve spent the past 1-2 months raising cash in my long term portfolios. I rode the rotation out of the S&P 500 into EM and energy, and made some money going long oil and tactically trading gold and SPX. I’m now focusing on recession trades that I believe will pay off over the coming months or quarters.
Today’s paid subscriber section is free: Current positions, including the trades I’m putting on to position for a recession, plus the gold chart that will dictate how I trade the next few months.
ES - I bought SPX futures at 6407 yesterday and benefited from the 120 squeeze off the low. I moved my stop to breakeven, and it was triggered during the US cash session.
Gold
I think we have a chance of moving up towards the top end of this parallel channel. However, if I’m right about recession and risk off, gold will struggle to maintain upward momentum and could fail at the top of the channel. I went long yesterday and will look to take profit at 5100 in spot.
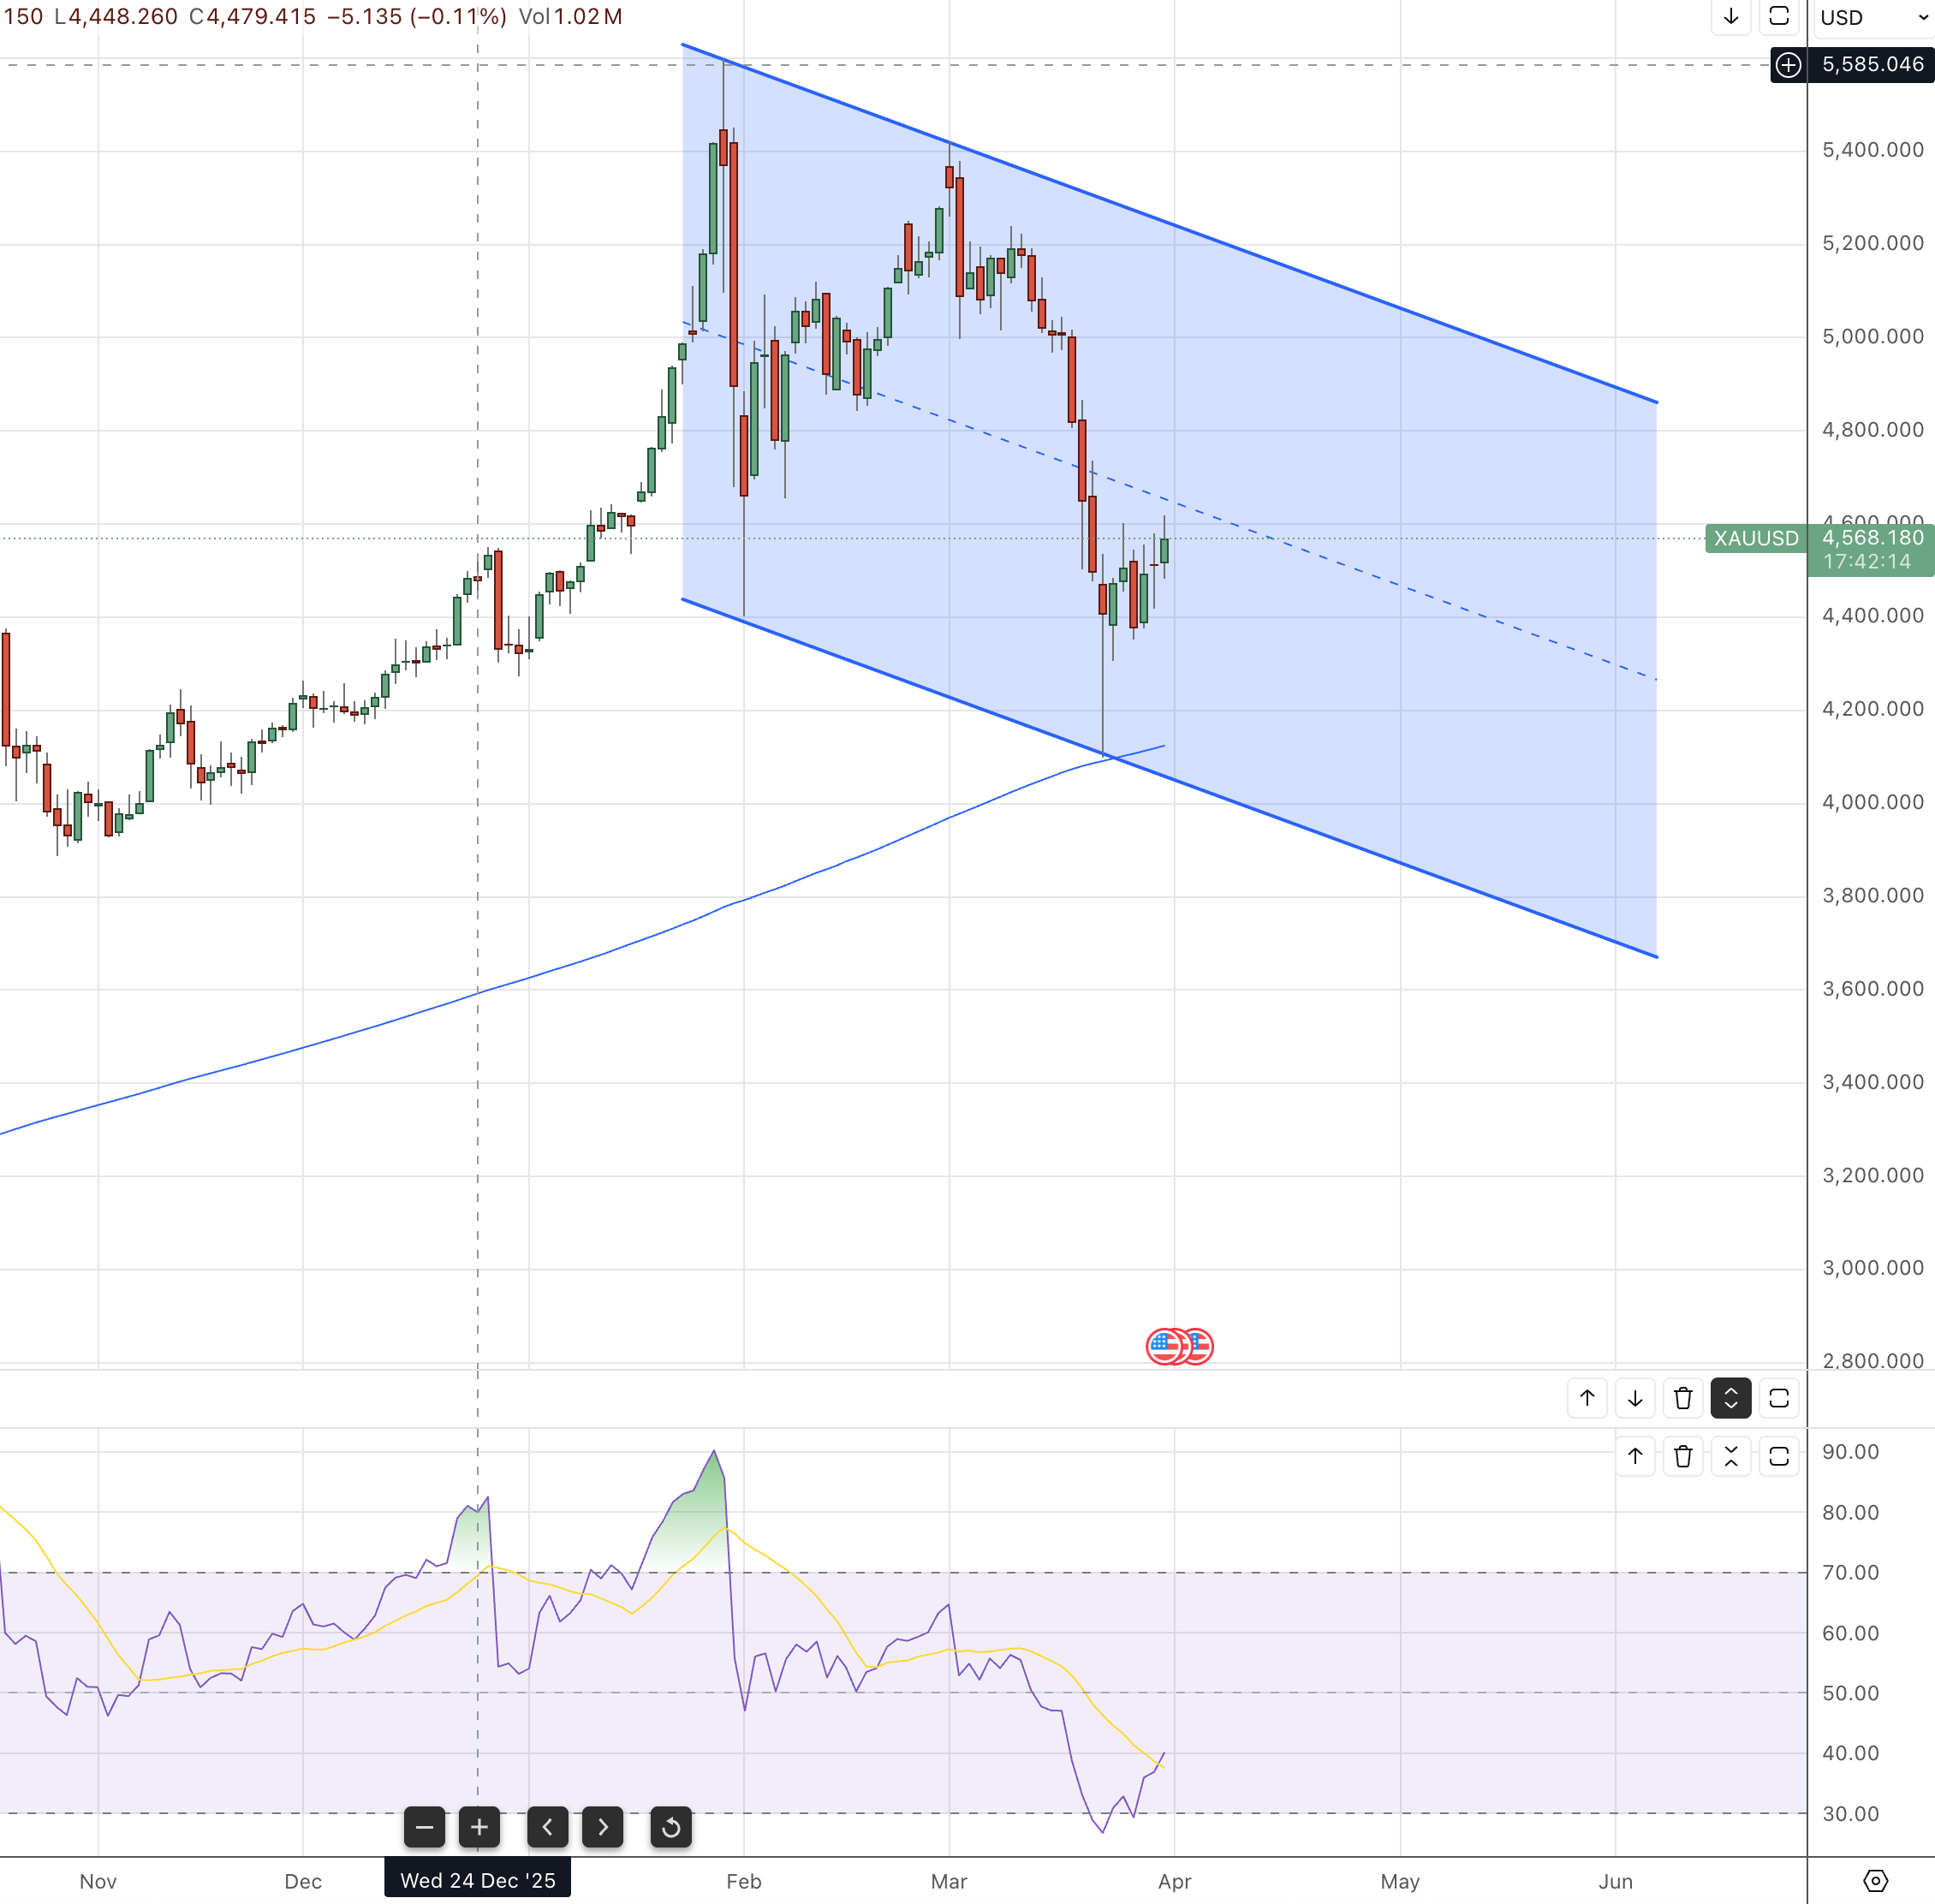
This channel also implies that gold is not done making new lows. We could see 3500-4000 this year before the uptrend resumes.
Long June 2027 SOFR
I went long June 2027 SOFR futures at 96.42 - not far from where the market is right now. SOFR futures sold off this month on expectations that the Fed would no longer be able to cut this year and on the unwinding of popular hedge fund trades. For a couple weeks, we saw equities down = SOFR futures down, but that relationship broke last Friday.
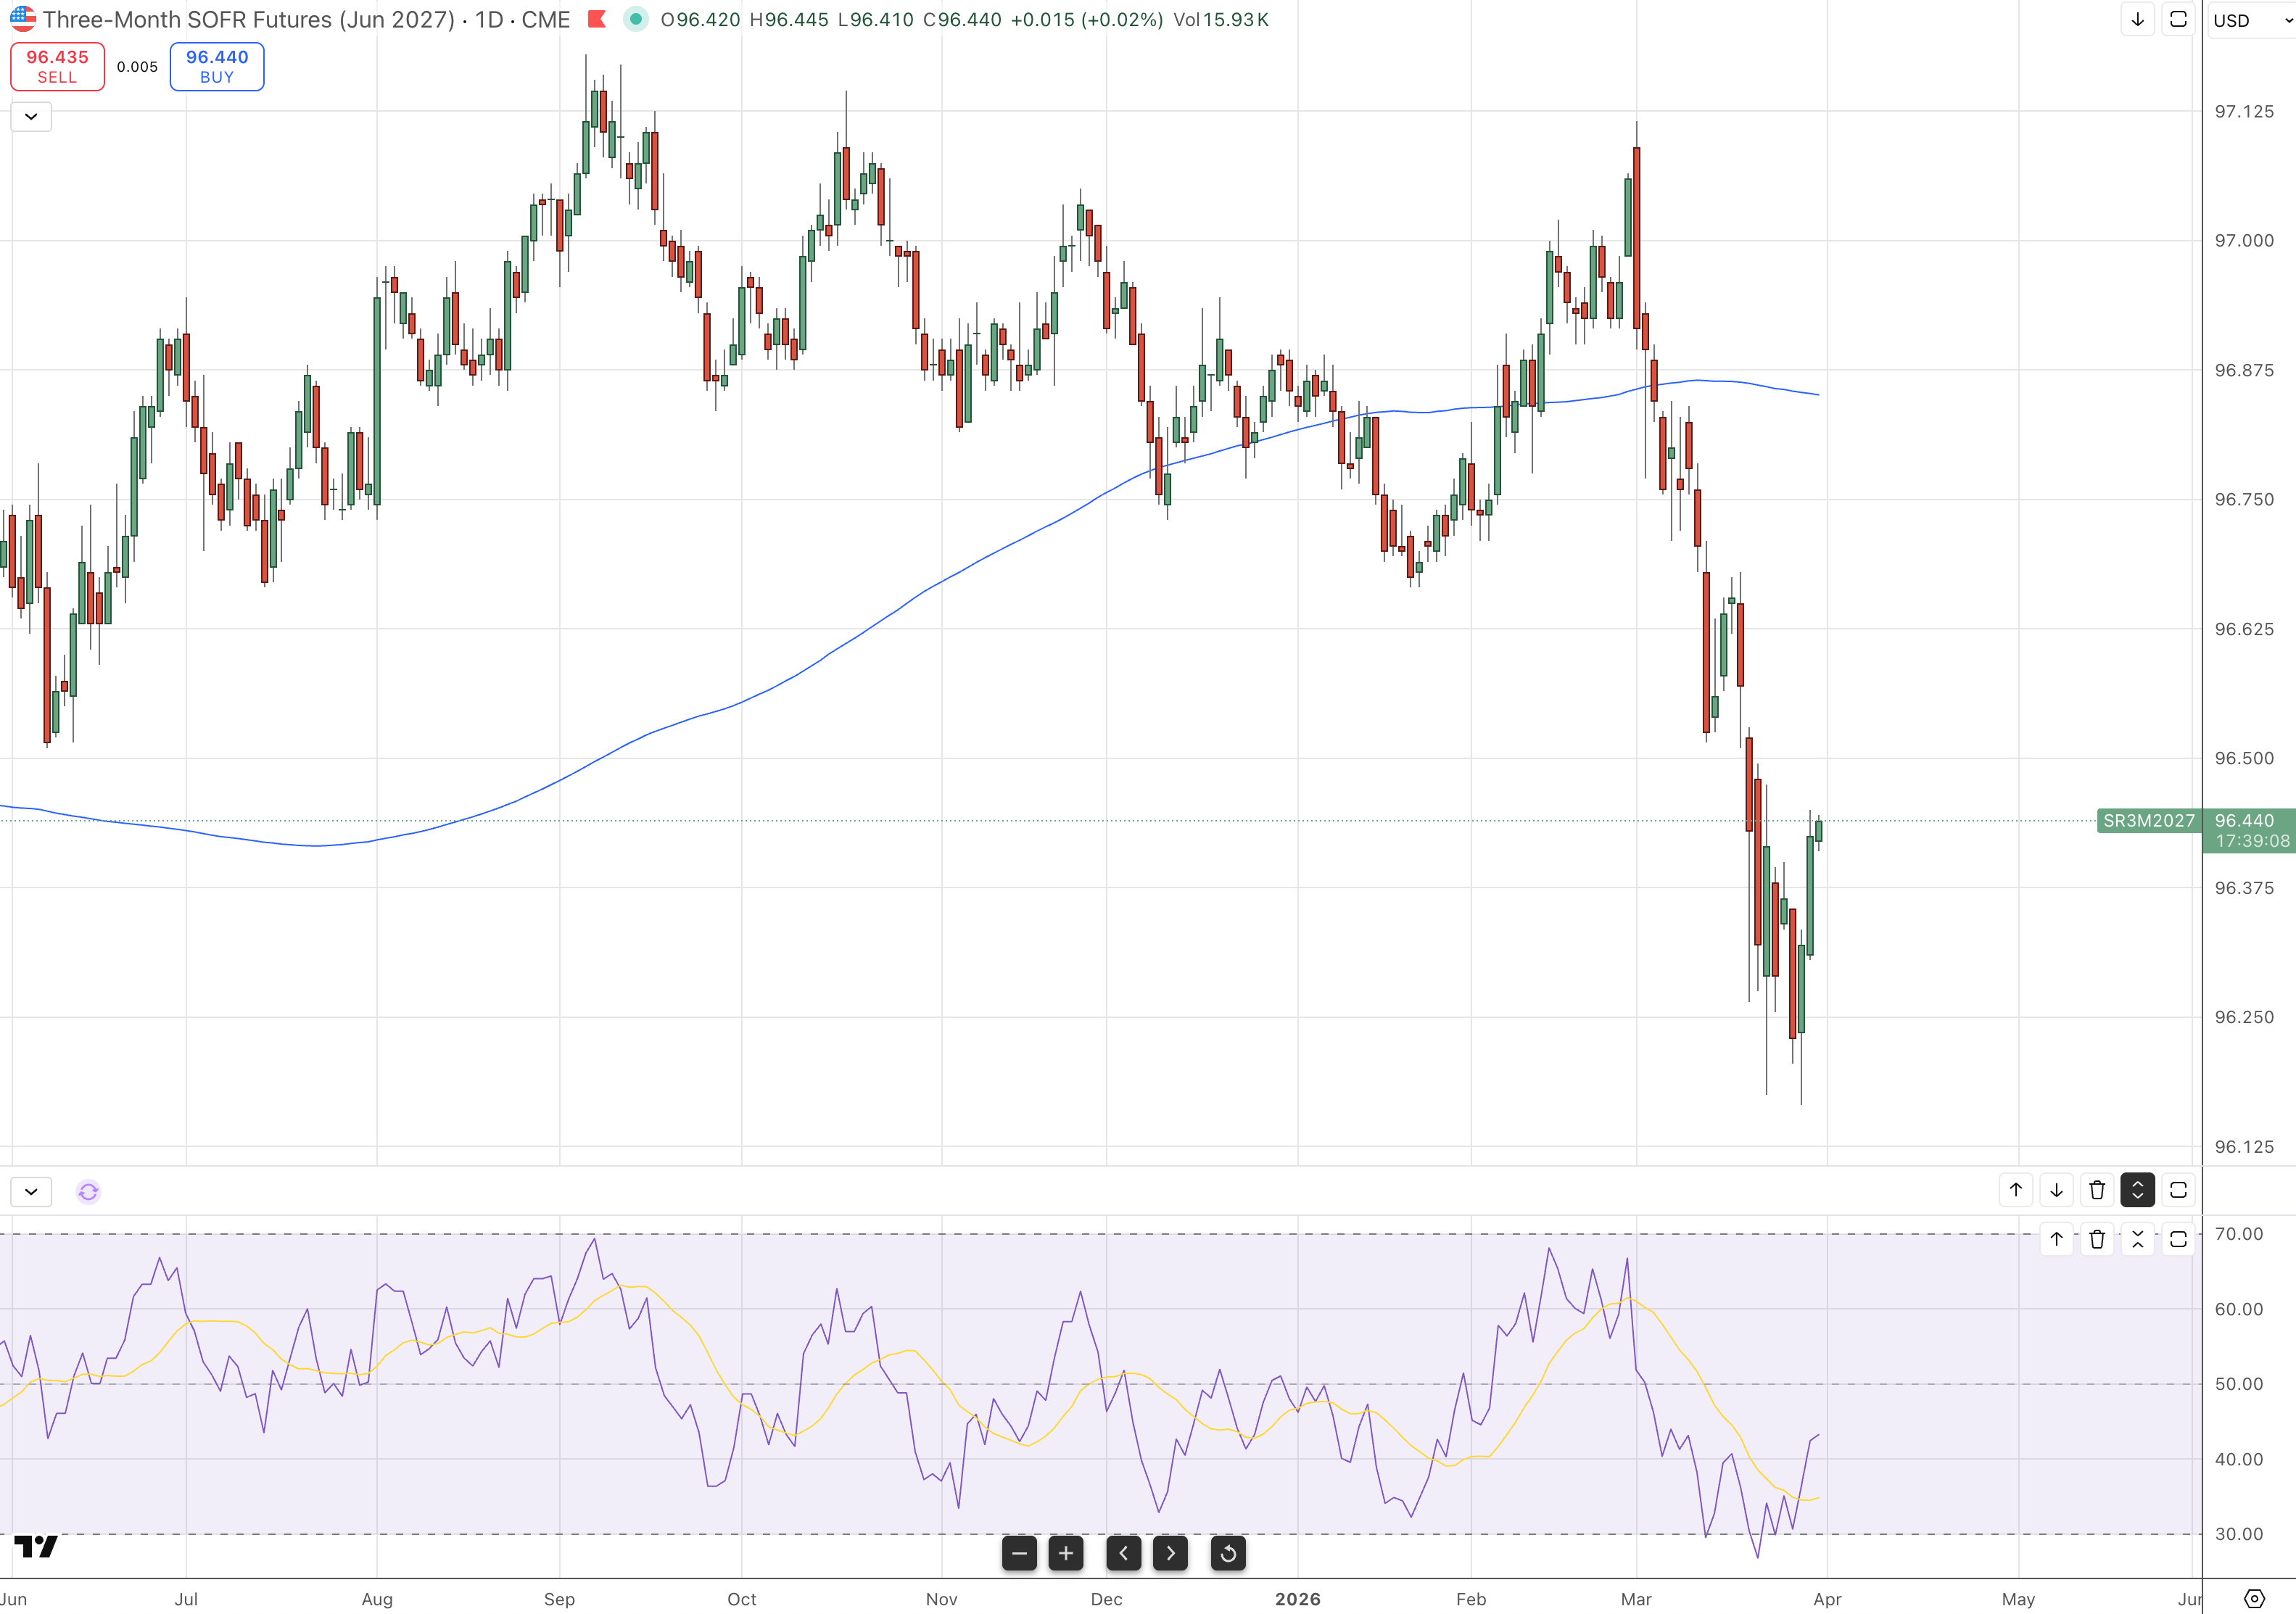
The breaking of the correlation suggests that the market 1) Sees value in the SOFR curve, as it’ll be a stretch for the Fed to hike into a stagflationary shock, and 2) The market is starting to shift its focus on the potential for a recession down the line.
Talk to any seasoned global macro trader, and you’ll learn that long SOFR futures (previously eurodollar futures) is one of the best ways to position for a recession. The short end of the rates curve is more responsive to weakening economic conditions, whereas the S&P 500 can continue making new highs well after the economy has already started to deteriorate. The decisions of policy makers can trigger sharp short squeezes in equities, making it difficult to hold on to short positions or long puts. By being long SOFRs, you are long the medicine that the Fed needs to deliver. Timing the exit on the trade is also less of a problem, as interest rates usually stay low long after the equity market has bottomed.
If I’m right on this trade, I could be going long at the ground floor of a several hundred basis point bull market in SOFRs. It’s the kind of trade a global macro trader can put on in size and take the rest of the year off while the world blows up around him.
Because I can’t help myself, I also spent several hundred bp of capital on six month puts of several single name stocks that I think will sell off particularly hard in a recession. I’m out of time so will save that for another post.
Disclaimer: The content of this newsletter is provided for informational and educational purposes only and should not be construed as professional financial advice, investment recommendations, or a solicitation to buy or sell any securities or instruments. The newsletter is not a trade signaling service and the author strongly discourages readers from following his trades without experience and doing research on those markets. The author of this newsletter is not a registered investment advisor or financial planner. The information presented on this newsletter is based on his own research and experience, and should not be considered as personalized investment advice. Any investment or trading decisions you make based on the content of this newsletter are at your own risk. Past performance is not indicative of future results. All investments carry the risk of loss, and there is no guarantee that any trade or strategy discussed in this newsletter will be profitable or suitable for your specific situation. The author of this newsletter disclaims any and all liability relating to any actions taken or not taken based on the content of this newsletter. The author of this newsletter is not responsible for any losses, damages, or liabilities that may arise from the use or misuse of the information provided.