
Boosting returns by swing trading S&P 500 futures (part 1)

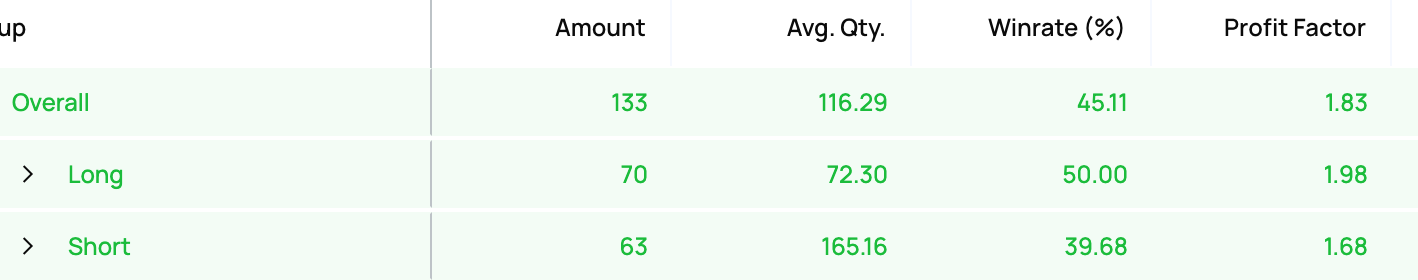
Swing trading S&P 500 futures is one of my favorite and most profitable strategies. E-mini S&P 500 futures (ES) is one of the most liquid and active markets in the world, trading 24 hours a day for five days a week. Its deep liquidity lets traders move eight-figure positions with a single click. Ever since I added this strategy to my toolkit, it has contributed a third to half of my annual profits. Over the past two years, I’ve taken 133 trades in this market with a 45% win rate and a profit factor of 1.83.1
What I like about this strategy is that ES is extremely responsive to what’s going on in global macro and that this strategy can scale as my AUM increases over time. My edge comes from reading the US economy, Fed policy, geopolitics, and price action - skills that translate directly into trading performance. ES also has a natural upward bias, so when I’m long (which is the majority of the time), I benefit from the persistent rise in US corporate profits and global liquidity. When I go short, those positions serve as a hedge for my long-term equity and private investments.
I trade ES from the Asia time zone, which means I’m asleep for the majority of the cash equity market session. My time zone puts me at a disadvantage, and I’m confident that my results would be even stronger if I was based in the US. To manage risk while I’m offline, I enforce strict stop-loss rules to prevent sharp drawdowns.
Taking a directional view
My trading starts with taking a directional view on the market - whether ES is likely to trend up, move sideways, or decline. This view is shaped by my outlook on Fed policy, economic data, and geopolitical catalysts.
In an uptrend, I look for technical setups and dips to go long; in a downtrend, I do the opposite. When I expect sideways consolidation or have no strong directional view, I take both long and short setups depending on short-term catalysts. Those who want real-time updates on my ES views can upgrade to a paid subscription below.
The Basics
Sizing - Because I trade ES more frequently, I size trades by risking 70-100 bp of trading capital - a little smaller than trades in other asset classes. With this sizing, a string of 2-4 losses within the space of several days won’t be as crippling.
Time horizon - 1 to 4 days, depending on how persistently the market goes in my favor
Risk management - I place my stops 0.4-0.8% (30-60 pts) away from my entry, which allows me to take outsized notional positions relative to my capital. Tight stops require precision and timing on my entries, and when executed well I can capture a 60-150 pt move in the market that delivers me 2-5R in profits. Once a trade goes in my favor by 1R, I trail my stop close to breakeven and continue adjusting as profits build. I usually have a target in mind based on a key technical level and use the 1:1 trailing stop rule to lock in gains as price approaches it.
Framework of risk premium
My definition of risk premium for the purposes of this guide is the market pricing a probability of the worst case impact of an event on corporate profits. This is not to be confused with the equity risk premium, a formulaic spread between earnings yield and the risk-free rate. Expanding risk premium means heightened downside volatility (both implied and realized) and greater market fear, and contracting risk premium equates to recovering prices, receding fear, and declining volatility. My trading approach essentially anticipates or reacts to events that expand and contract risk premium.
The concept is sometimes described as the “wall of worry.” The market constantly finds reasons for concern, which draws in shorts and keeps buyers sidelined. As those worries fade, shorts are forced to cover, buyers chase higher prices, and the market climbs the wall of worry.
Geopolitical risk premium
Examples of geopolitical risk premium include Trump’s tariff announcements on Liberation Day, the escalation of the US–China trade war over rare earths in October 2025, and the military conflict involving Israel, Iran, and the US. In each case, risk premium expanded and ES sold off as events unfolded. Once enough fear was priced in, dip buyers betting against the worst-case outcome stepped in, compressing the risk premium over the following days and weeks. Anticipating the market’s next move depends on assessing the full range of possible outcomes in a crisis and identifying which scenario the market is currently pricing. When the market anchors on an extreme outcome, it often misprices the probability of that scenario. Recognizing this disconnect creates an opportunity to profit.
I’ll use Liberation Day in April as a case study. As shown below, I shorted ES during Trump’s press conference when he unveiled his placard of country-by-country tariff rates, capturing a massive 363-point move. That trade netted a 12% gain on my trading account and ranked among my most profitable of the year.
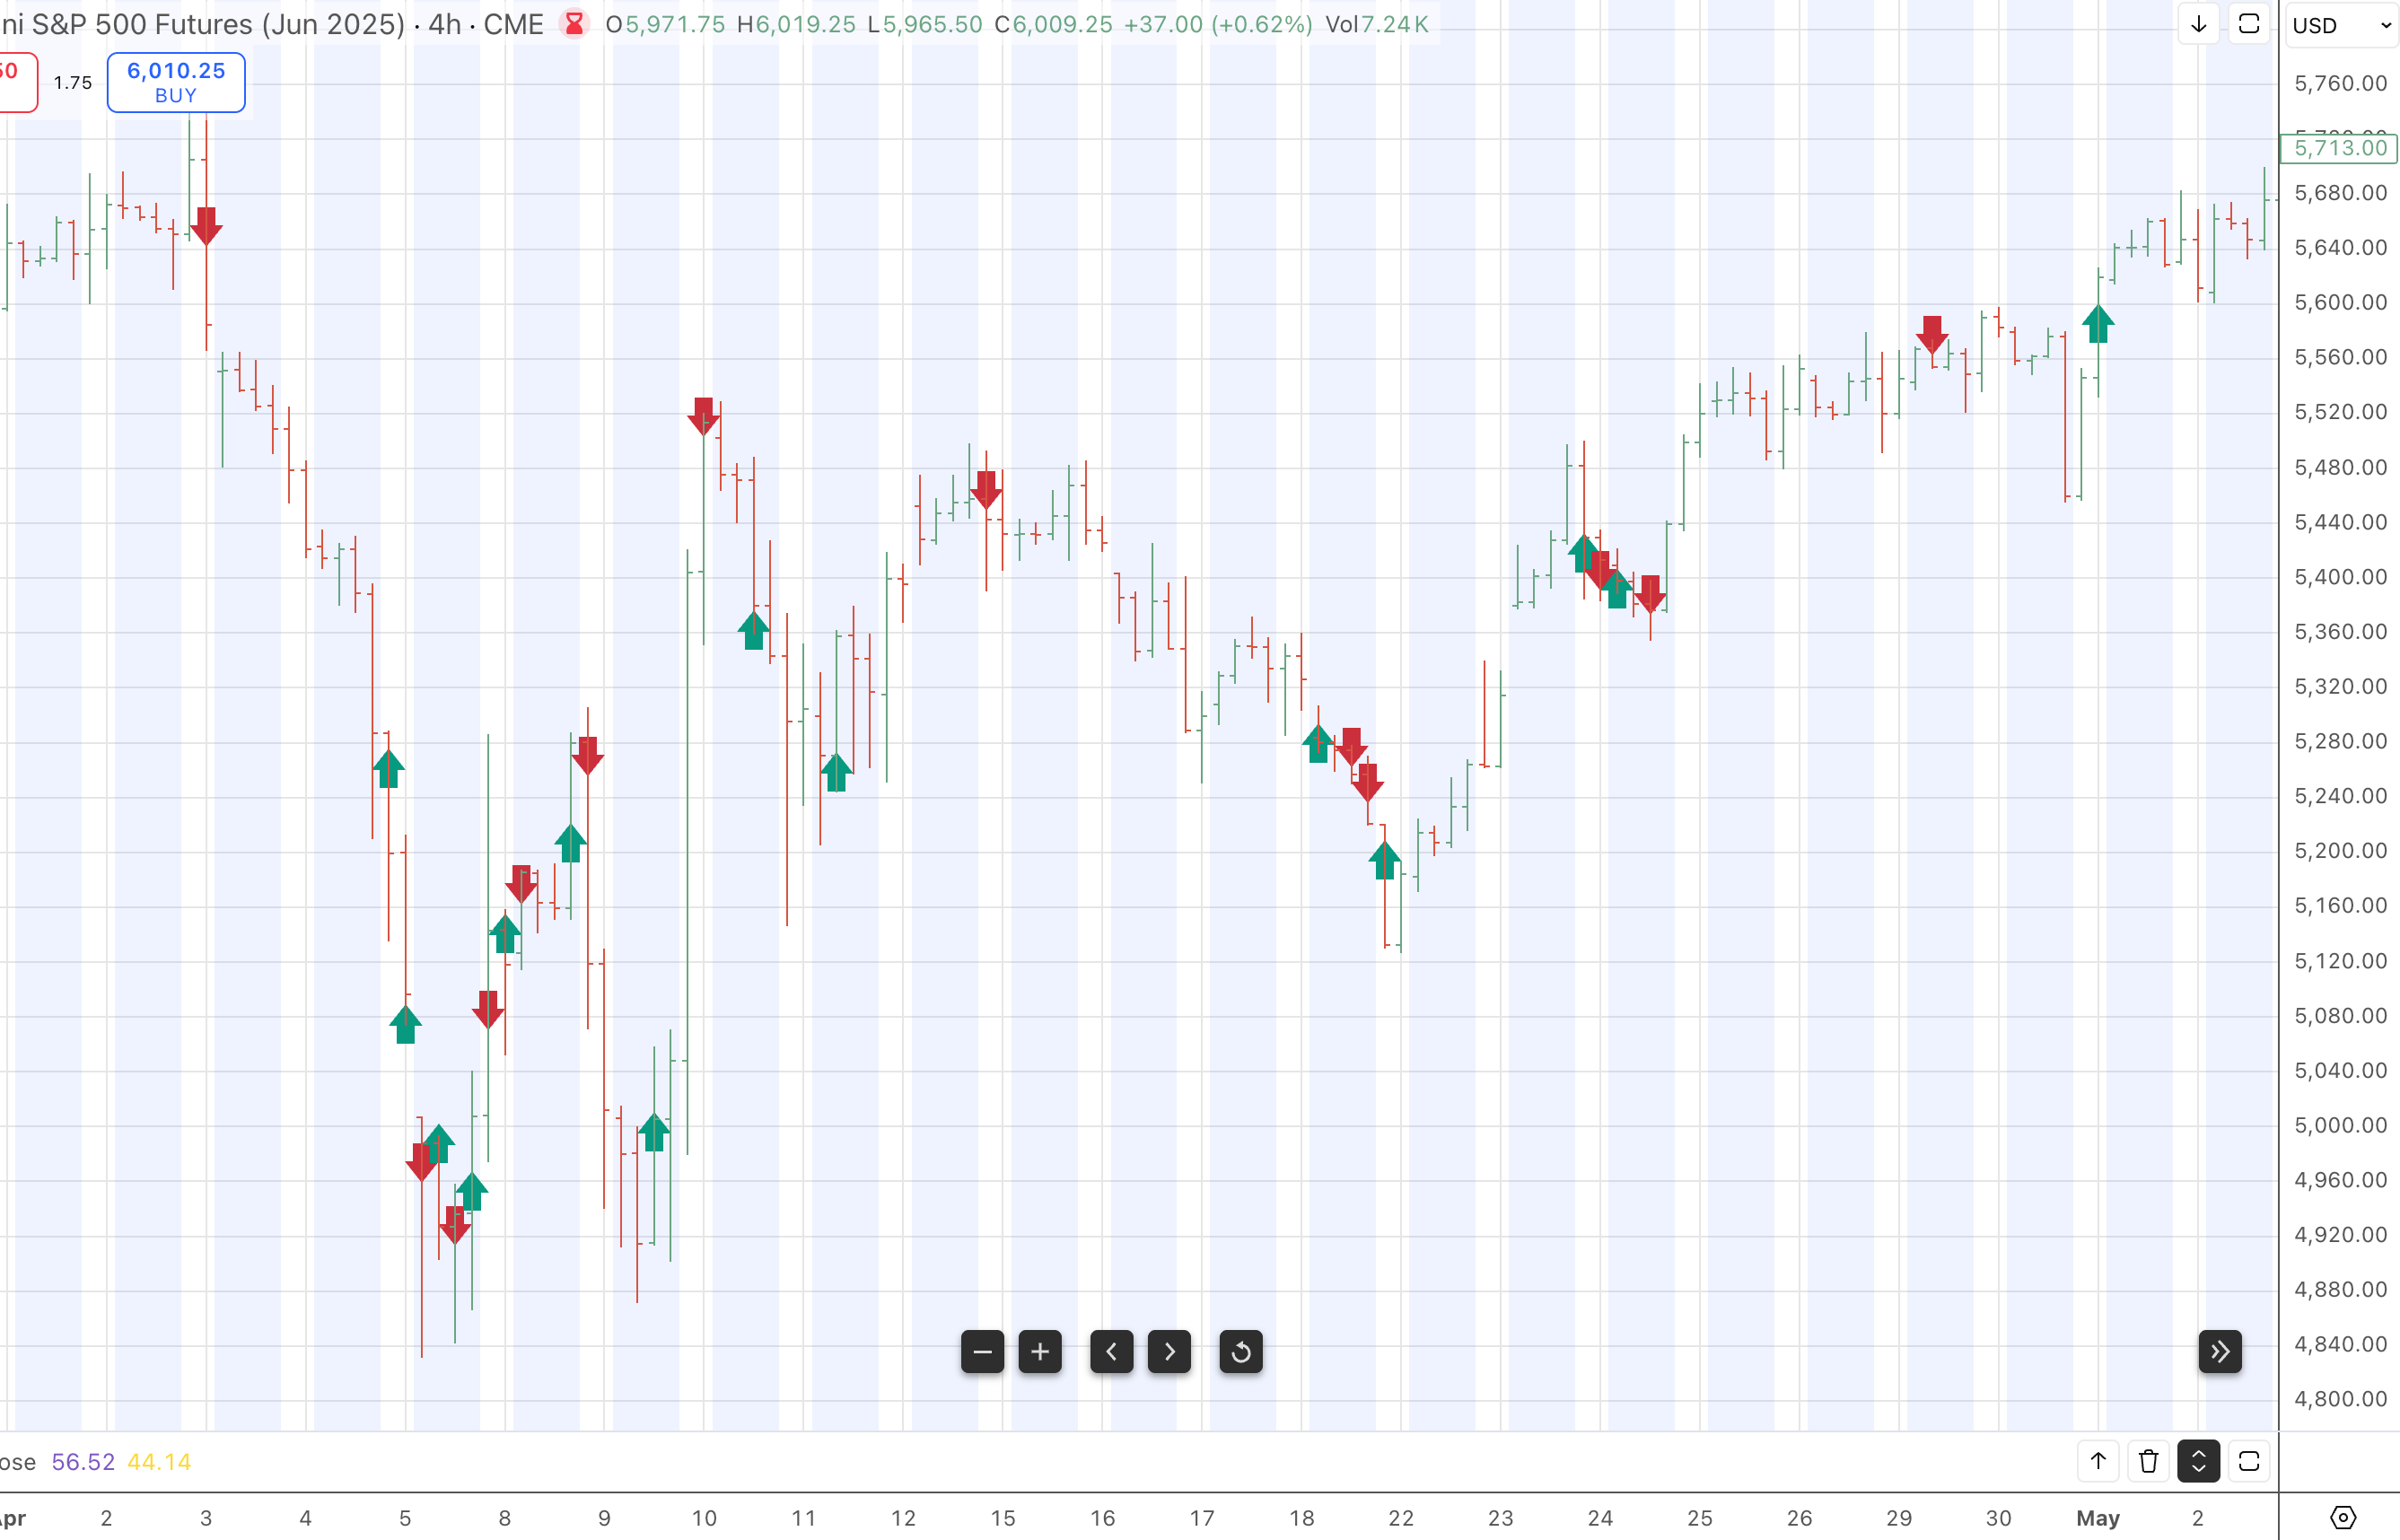
I spent the rest of the month buying on weakness and selling on strength with mixed results. When TACO emerged, I shifted to fully bullish and made another 8% in profit trading from the long side from 5800 to 6200.
When risk premium expands, the market rushes to price in worst-case outcomes. In this case, the market feared that the excessively punitive tariffs would tip the global economy into recession, and that the US would enter into a tit-for-tat escalation with China. From the Liberation Day announcement, ES took only three sessions to find the low. By April 5, it was down 21% from the highs - a steep discount for what was essentially a “manufactured” crisis driven by message rather than by policy. Once the geopolitical risk premium was overpriced, the bar for additional negative headlines to push prices lower became extremely high. Panic selling often marks the bottom because it becomes difficult for sellers to regain control once buyers step in. The news simply has to look “less bad” for markets to rebound. This environment rewards bargain hunters and lets put holders monetize their hedges.
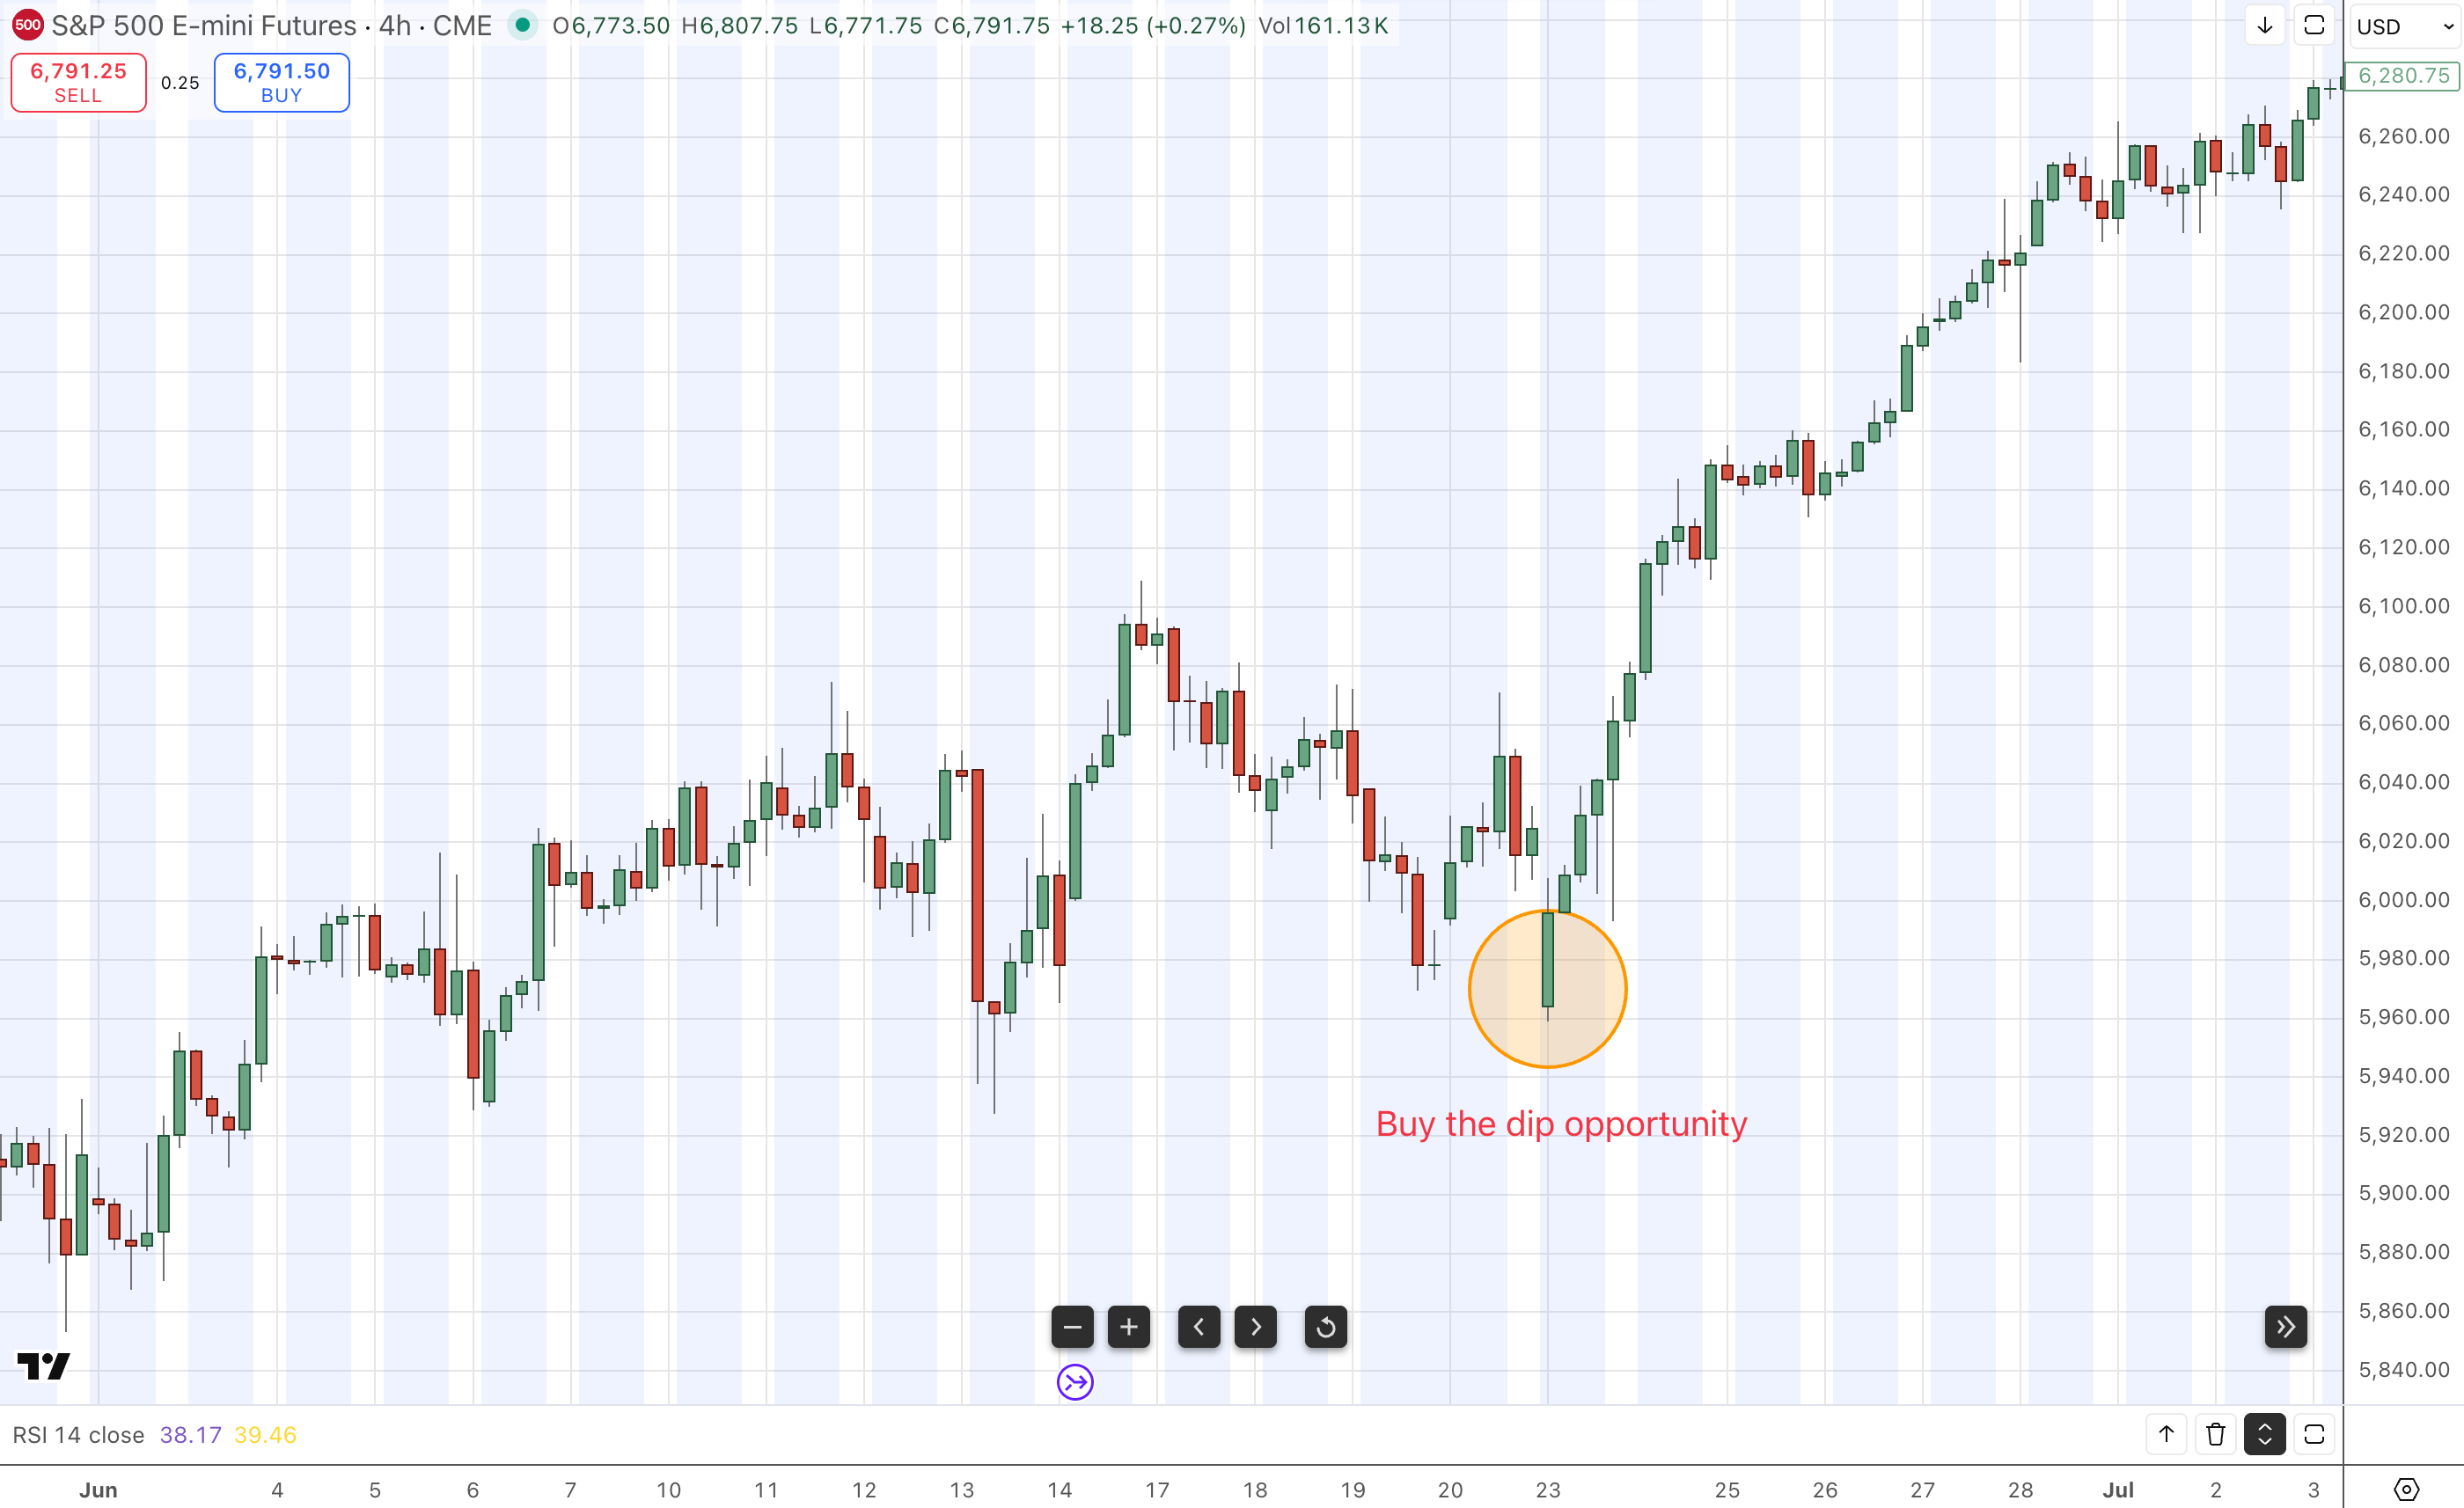
The 363-point gain from the geopolitical short was an outlier. Geopolitical risk premiums usually fade quickly and dips are bought. For example, the Israel-Iran tensions that briefly lifted oil and pressured ES in late June quickly reversed. After the U.S. strike on Iran over the June 21 weekend, ES opened lower on Monday. I bought ES and sold oil on the open, expecting that Iran would not blockade the Strait of Hormuz and that the strike would end the escalation. That view played out, and equities rallied sharply afterward.
Growth Shocks
The same risk-premium playbook applies to growth shocks, such as the COVID-19 selloff in March 2020 and the yen carry‐trade unwind in August 2024. In the case of COVID, announcements of cases and lockdowns perpetuated the selloff until the Fed stepped in and broke the bearish cycle by announcing record QE. Even though the global economy continued to suffer after that, the bottom was in by late March.
The yen carry trade unwind was triggered by a weak employment number and exacerbated by the selling of risk assets funded with yen shorts. The market rushed to price in aggressive cuts, providing the easing to allow the market to self-correct and recovery. In the COVID episode, I anticipated the shock and positioned early, and later even managed to flip to long equities. In the yen unwind, I didn’t catch the initial move but still profited on the rebound.
Leave your biases at the trading room door
Many traders carry a strong directional bias, especially toward shorting risk. Some global macro trades developed this during crisis periods like the GFC, and others simply find short trades more exciting when markets are falling apart. But ES spends most of its time rising, so most trades should logically be on the long side. Don’t handicap yourself by being the perpetual bear who gets squeezed over and over. The key is maintaining clear, unbiased judgment and being able to trade both directions.
In Part 2, I’ll explain how systematic funds and the options market shape price action, and how to use those flows to your advantage. I’ll also share the research and required reading that I use as informational building blocks of this strategy.
Profit factor is a performance metric that measures how profitable a strategy is relative to its risk. Greater than 1 means it’s profitable and less than 1 means it’s unprofitable. It’s calculated by dividing the pnl of all winning trades by the pnl of all losing trades.
look forward to part 2!